EMS is dispatched to a private residence for 70-year-old female who is believed to be unconscious.
On arrival, the patient is found lying in bed unresponsive to painful stimuli. The patient’s skin is pale and clammy. Her shirt is damp. Snoring respirations are noted and a slow carotid pulse is present.
A medical history is obtained from family members and includes heart failure, stroke, and hypertension.
Vital signs are assessed.
- RR: 8
- HR: Less than 30
- NIBP: 78/41
- SpO2: Not registering
- Temp: 96.1 F / 36.7 C
- BGL: 101 mg/dL
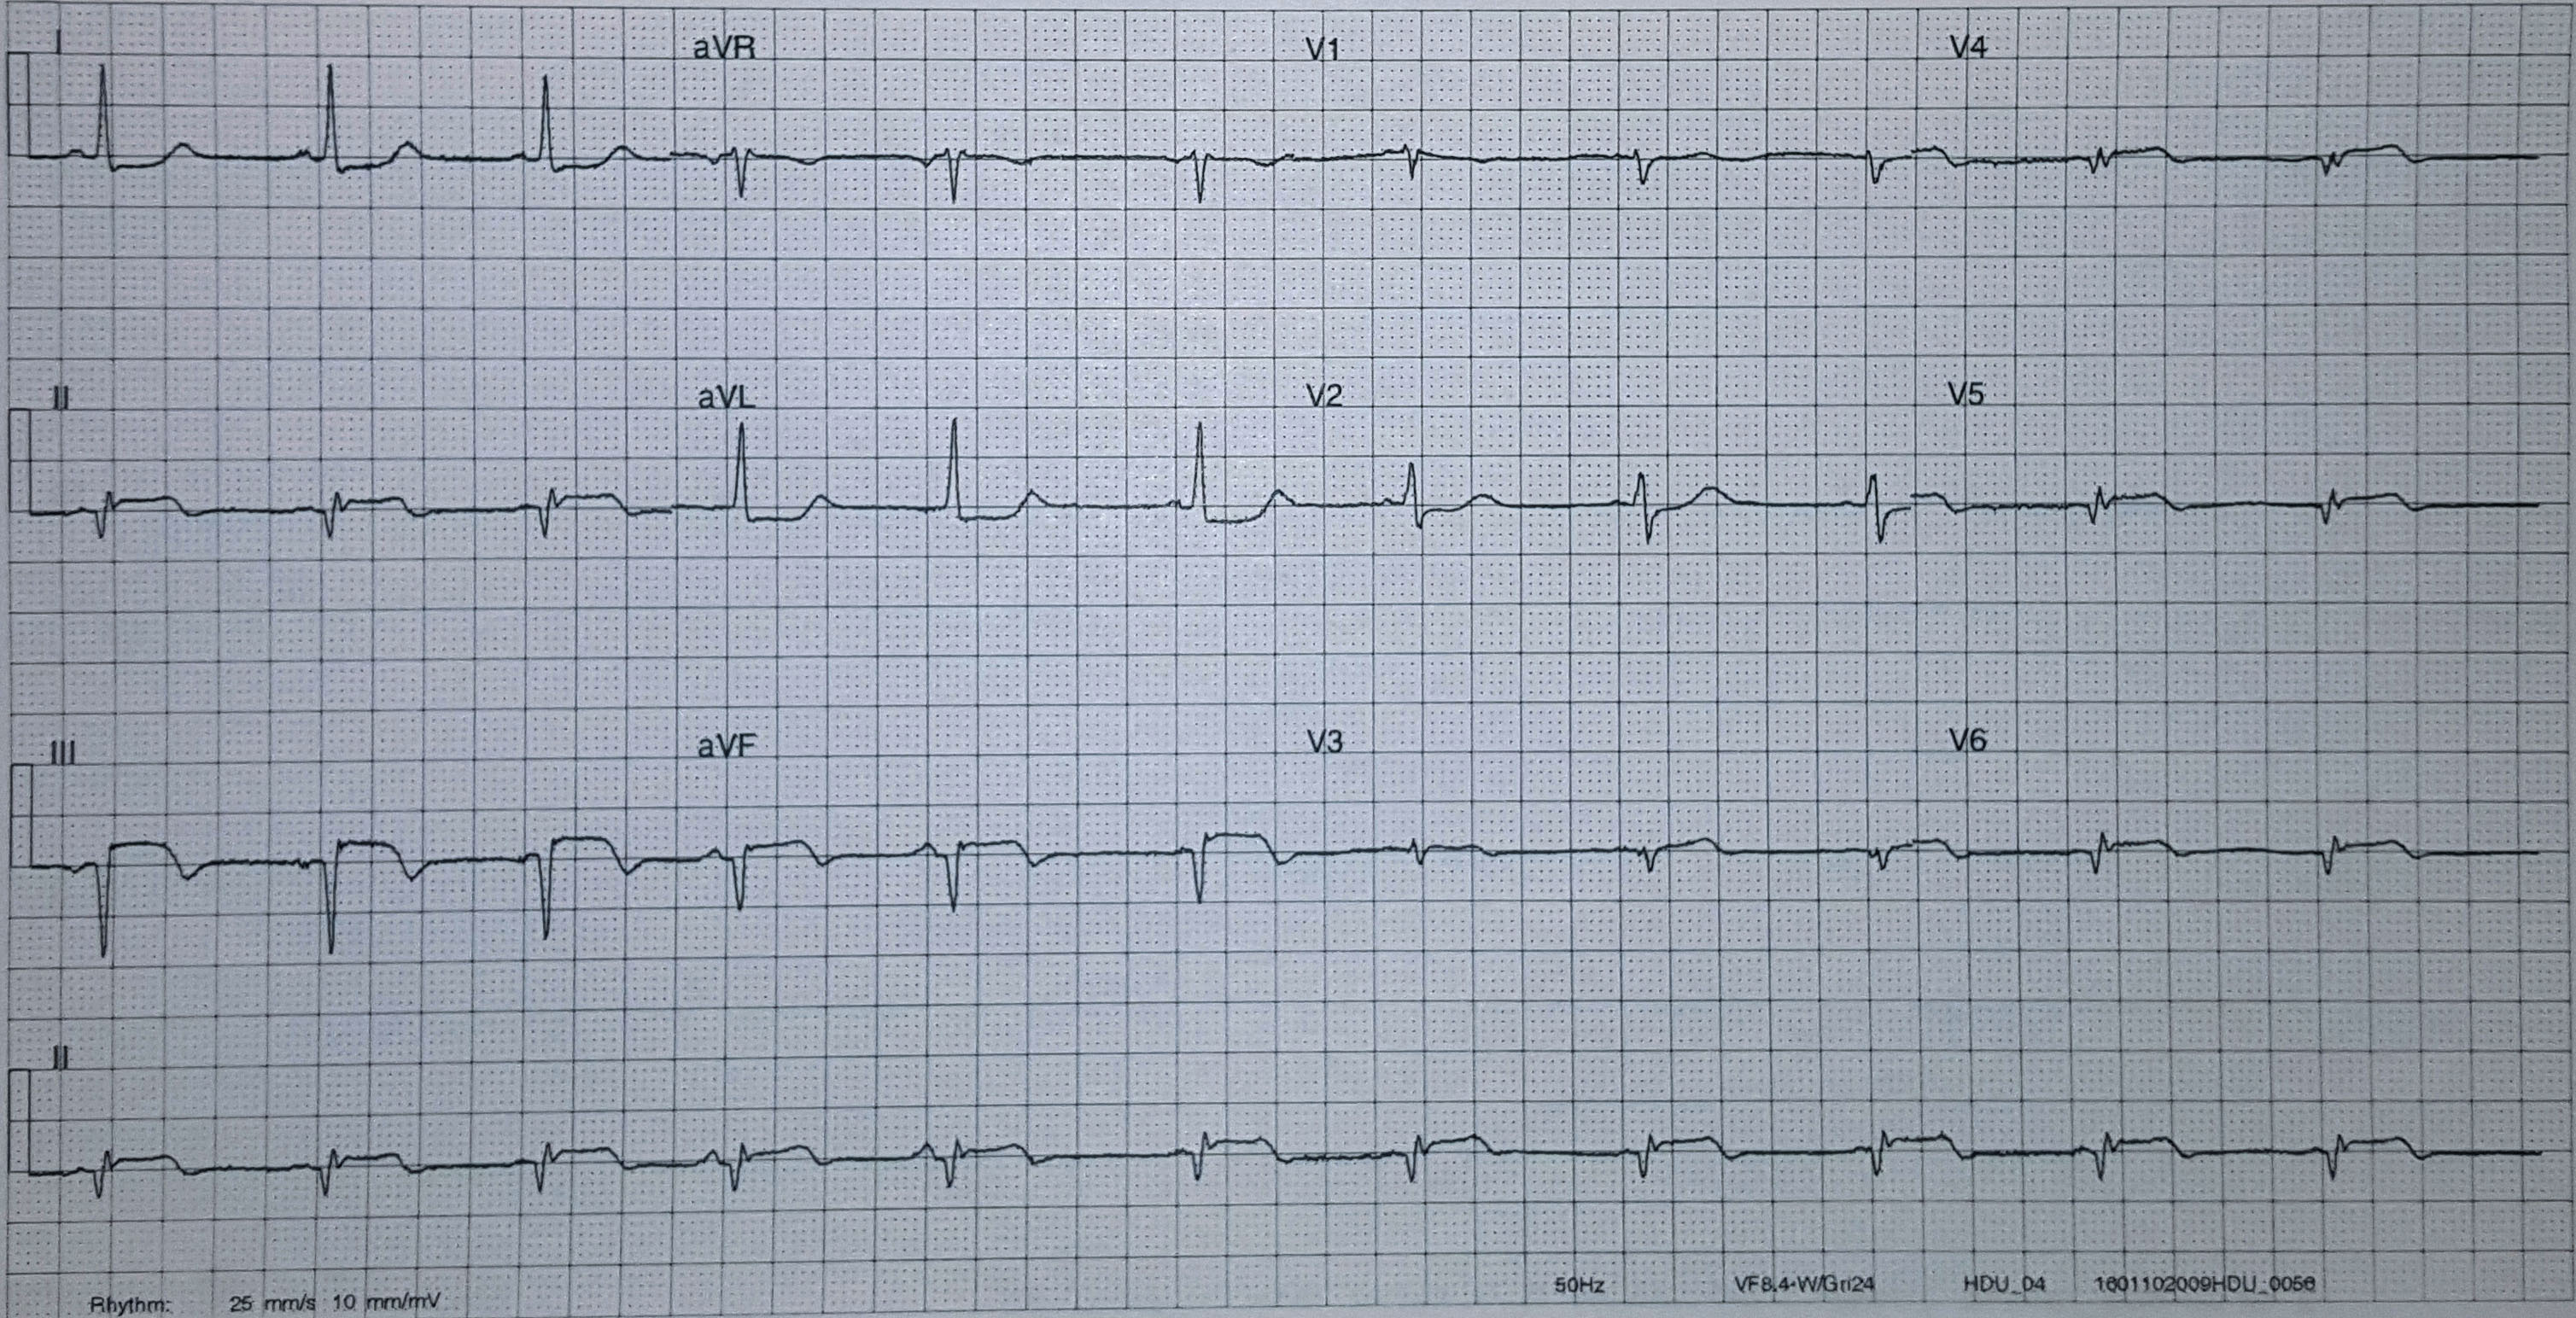
The cardiac monitor is attached.
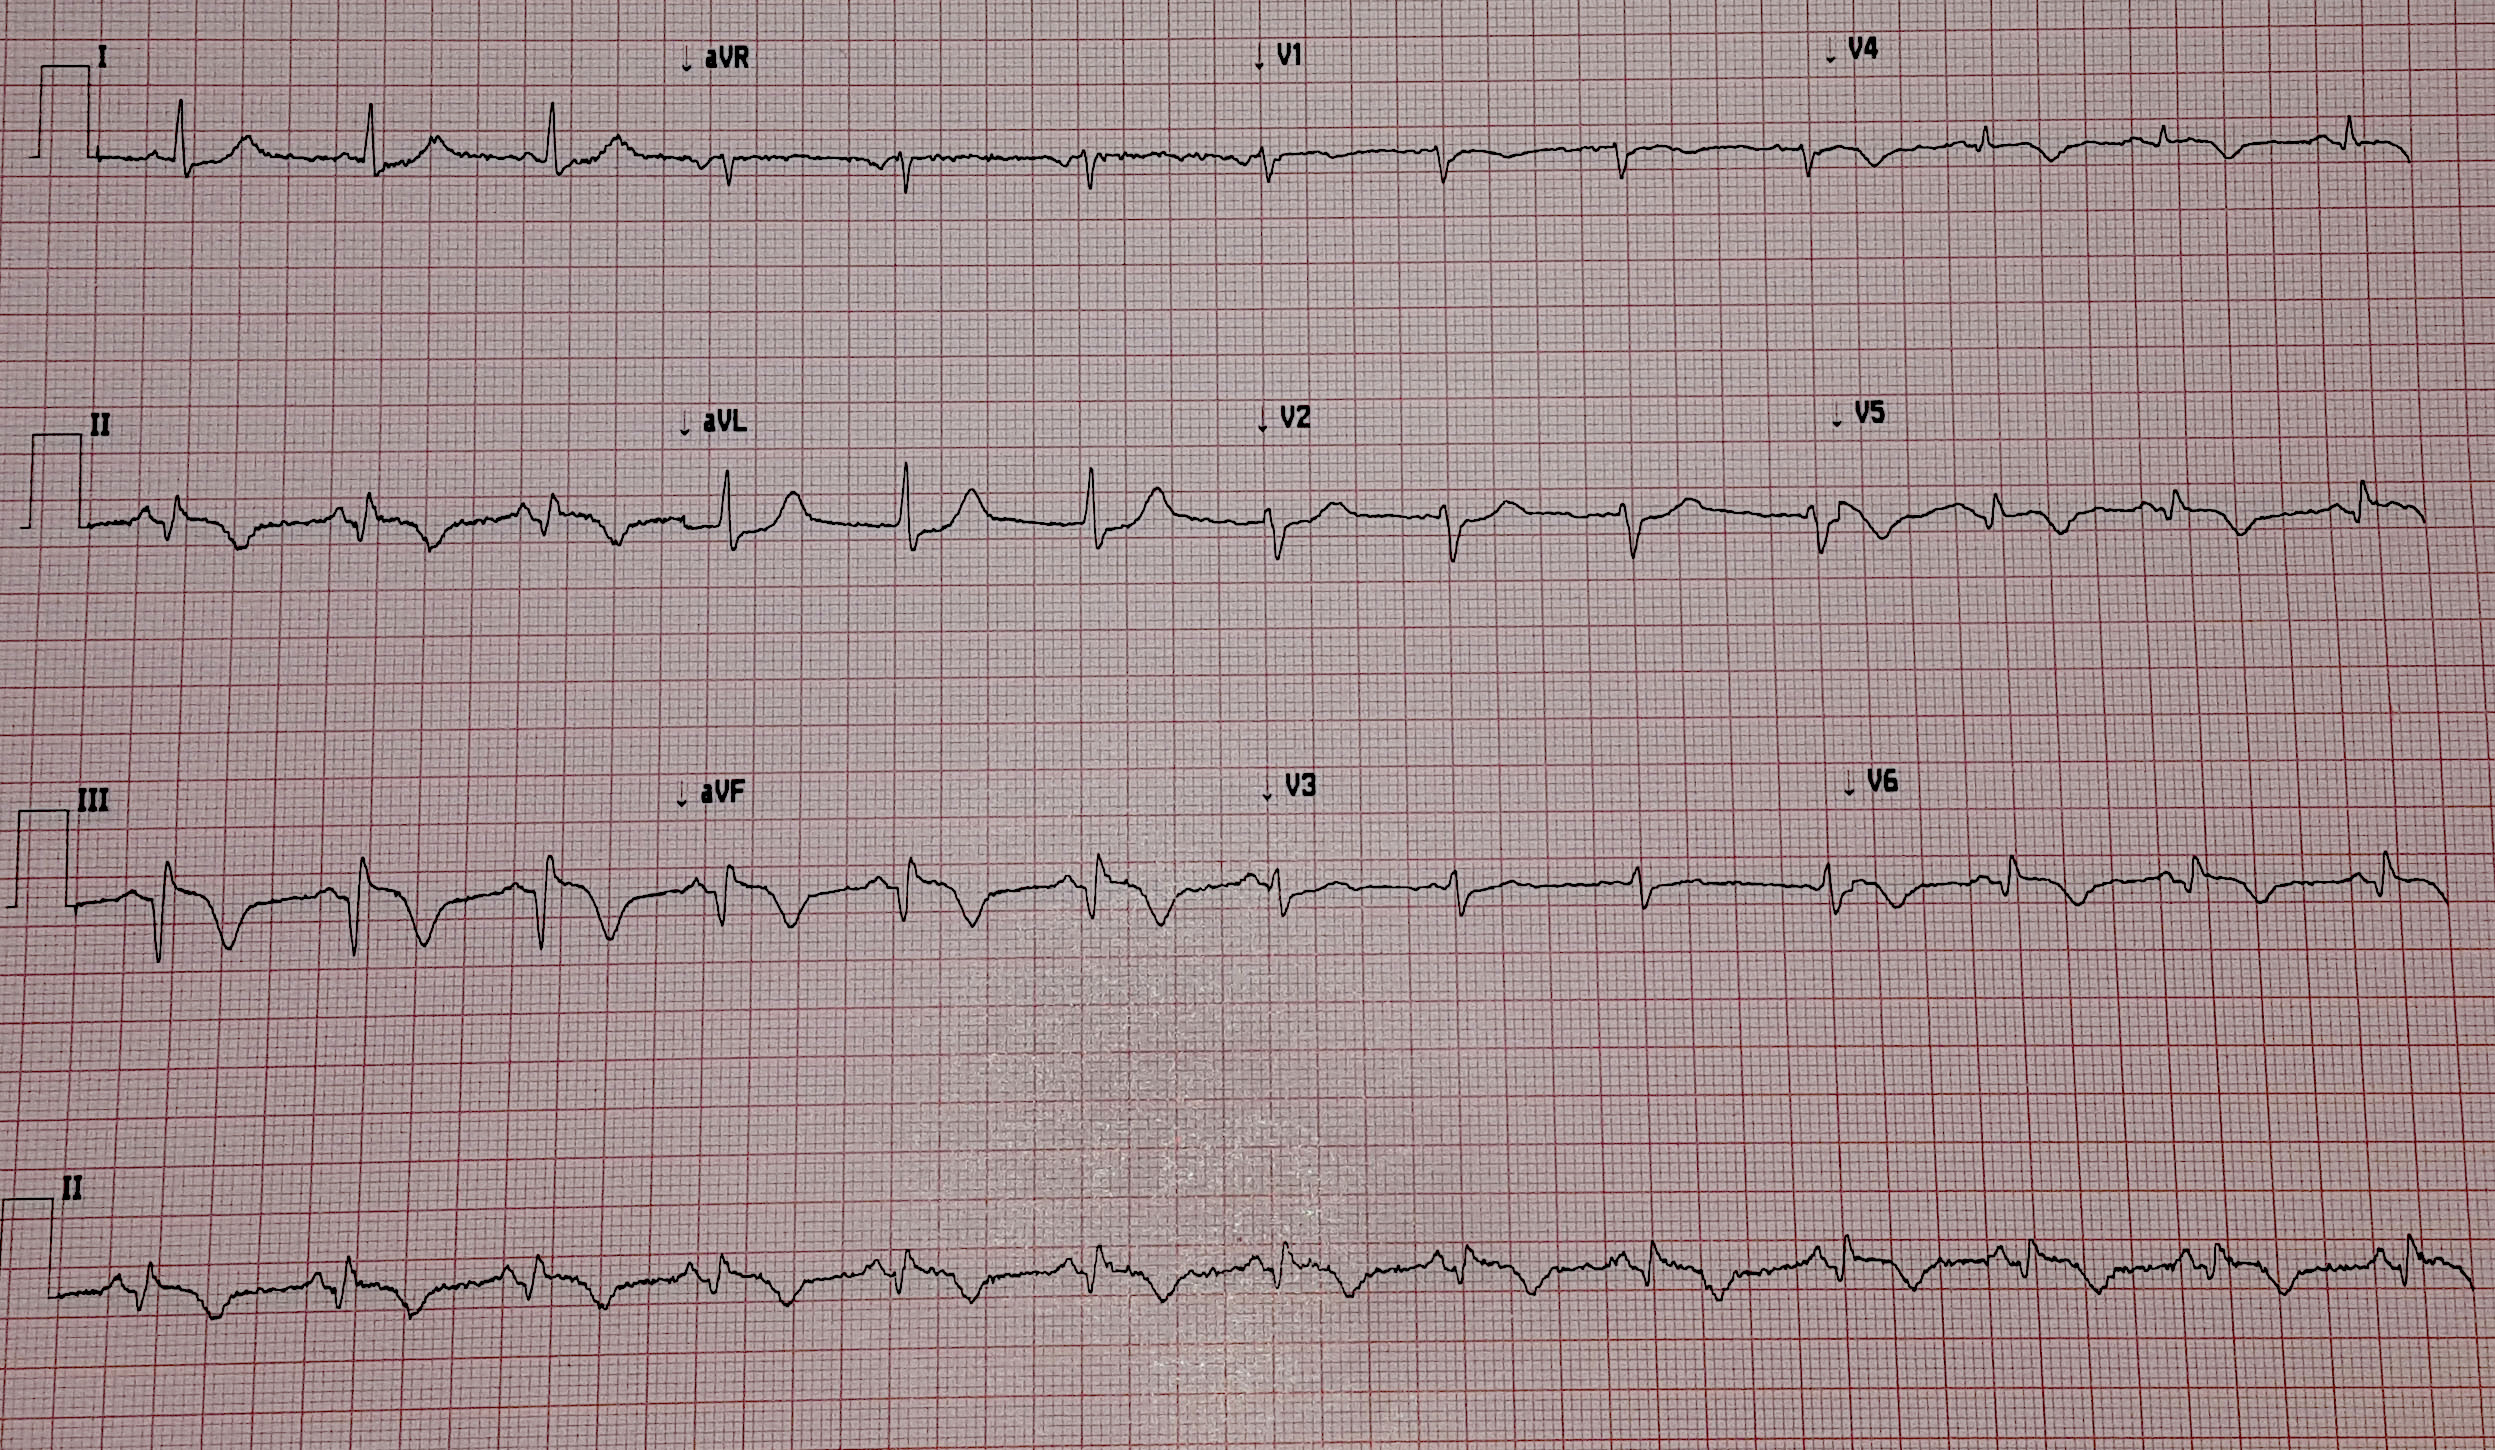
High degree AV block with wide complex escape rhythm.
The adult pads are placed and transcutaneous pacing is initiated.
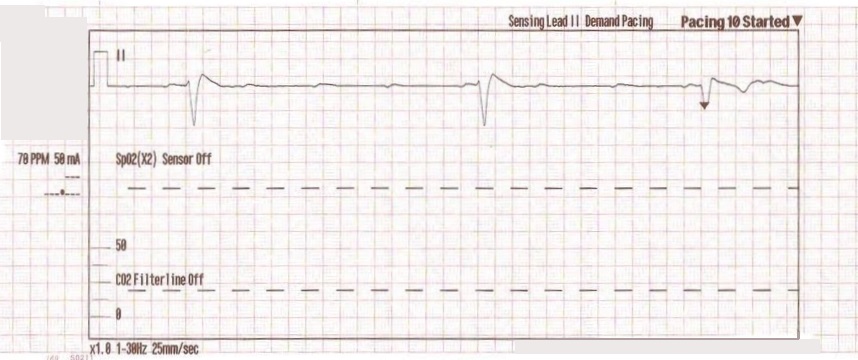
The transcutaneous pacer is set for 70 PPM at 50 mA. Pacing spikes are visible with what appear to be large, corresponding QRS complexes.
The patient’s blood pressure improves slightly to 84/47 (confirmed by auscultation). However, paramedics are still concerned about the patient’s hypotension.
Additional treatments
- IO access is obtained in right proximal tibia.
- 0.5 mg of Atropine is administered x 3.
- 9% normal saline is run wide open with an additional IV line established in the left lower extremity.
The patient begins to move and reaches for the pacing pads. However, she is still non-verbal and does not follow commands.
- On arrival at the hospital the patient is transitioned to transvenous pacing.
- She is sent to the cardiac cath lab where a permanent pacemaker is placed.
- In the ICU the patient remains dangerously hypotensive in spite of dobutamine and levophed drips.
The patient eventually expires from multiple-system organ failure.
Discussion
Transcutaneous pacing (TCP) is a difficult skill that is often performed incorrectly. The problem of false capture (also known as echo distortion) is under-recognized and under-reported in the medical literature.
There are many reasons why medical professionals often fail to achieve true electrical and mechanical capture. Consider this excerpt from the Journal of Emergency Medicine where Douglas Ettin, M.D. and Thomas Cook, M.D. describe the difficulty.[1]
“Shortly after cardiac pacing was initiated, the patient’s systolic blood pressure dropped to 50 mmHg. The EKG monitor continued to demonstrate adequate ventricular capture by the pacer. The patient appeared to have palpable pulses; however, the rhythm contractions of the patient’s body from the pacer shocks made this assessment difficult. With the etiology of the patient’s hypotension unclear, the decision was made to use transthoracic ultrasonography to assess the adequacy of her ventricular contractions.”
“Initially, the ultrasound demonstrated ventricular contractions at a rate of 30-40 beats per minute. These heart contractions did not correspond with the surrounding thoracic muscle contractions generated by the pacer. The current was gradually increased to 110 mA, and the heart began to contract in unison with the pacer shocks. The patient’s blood pressure subsequently increased to 90 mmHg.”
You can see another example where an echo was used to verify capture here.
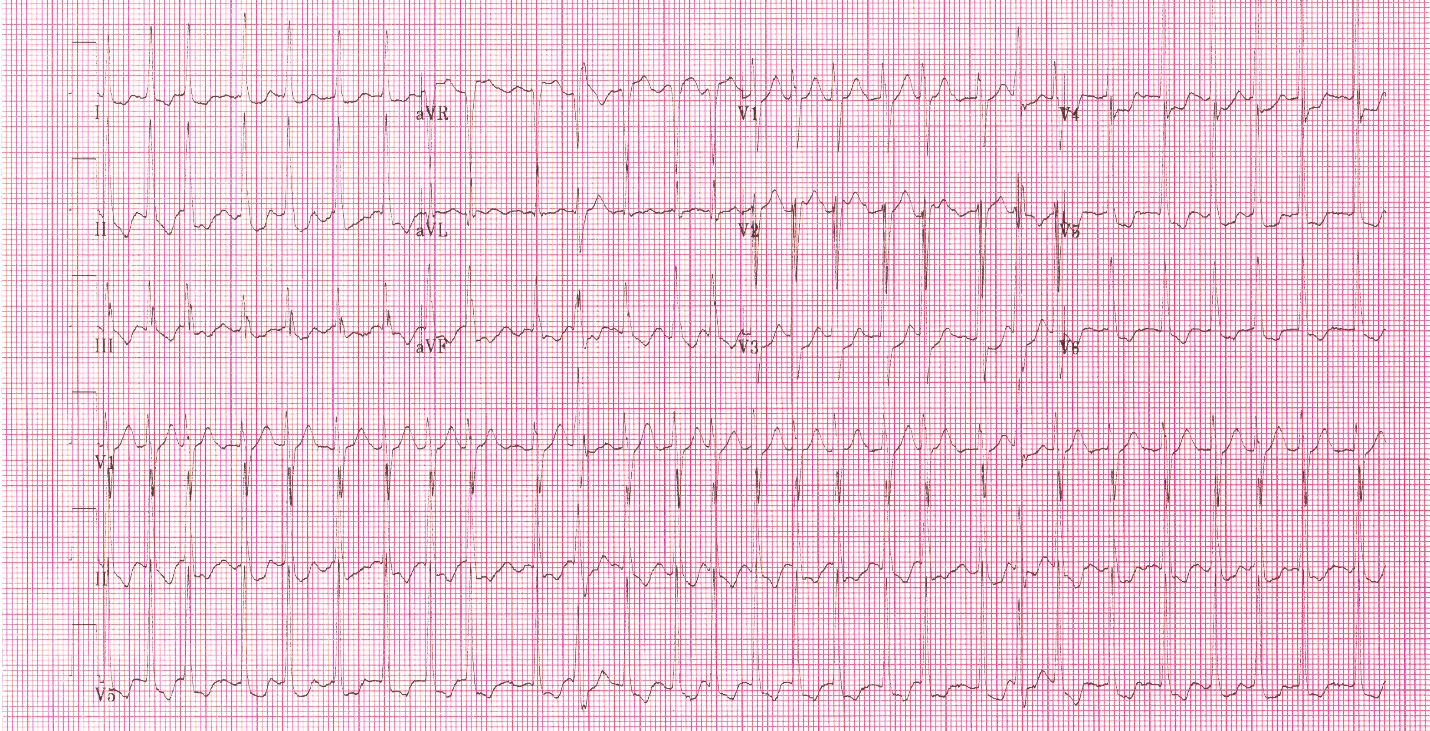
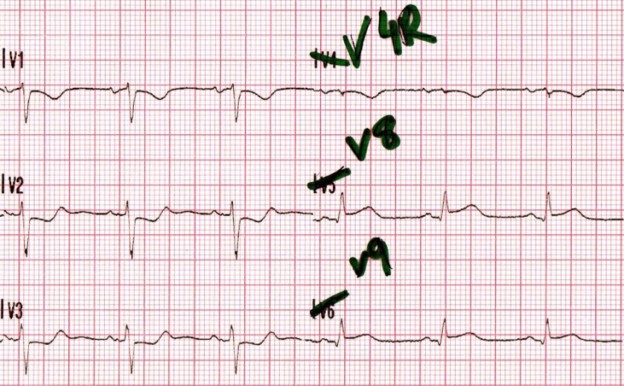
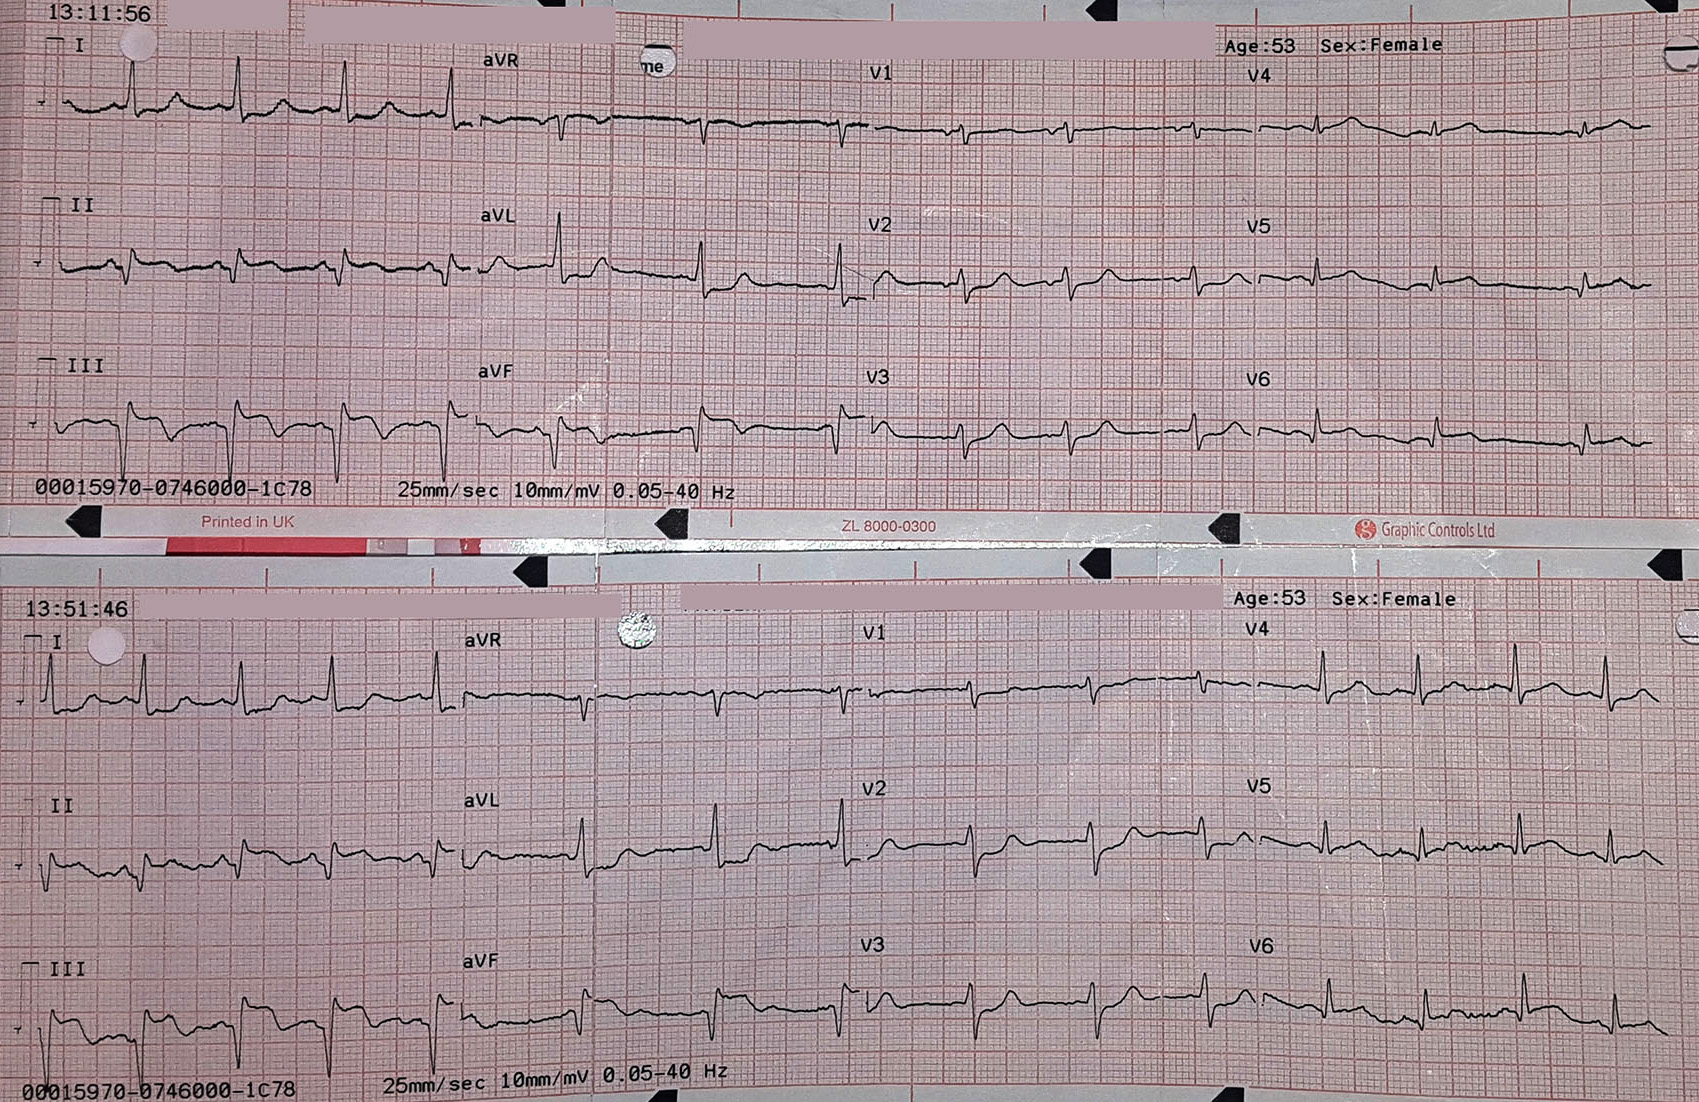
With false capture, you will generally see a near-vertical upstroke or down-stroke to the “phantom” QRS complex (which is actually electrical artifact created by the current passing between the pacing pads).
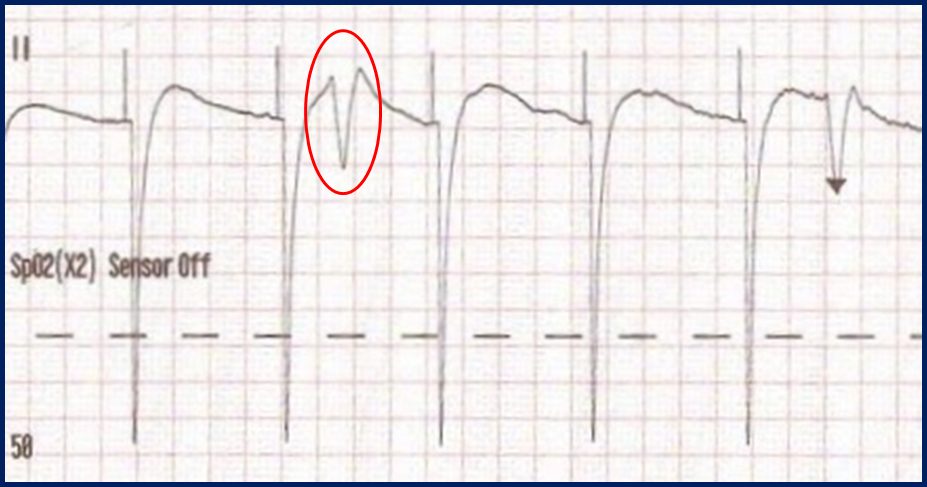
Classic “false capture” with near-vertical down-stroke of the (phantom) QRS complexes, slightly curved return to the isoelectric line, and unimpressive T-waves.
You will also note that the underlying rhythm can be seen in the absolute refractory period of one of the (presumed to be) paced QRS complexes (red circle). That is not scientifically possible!
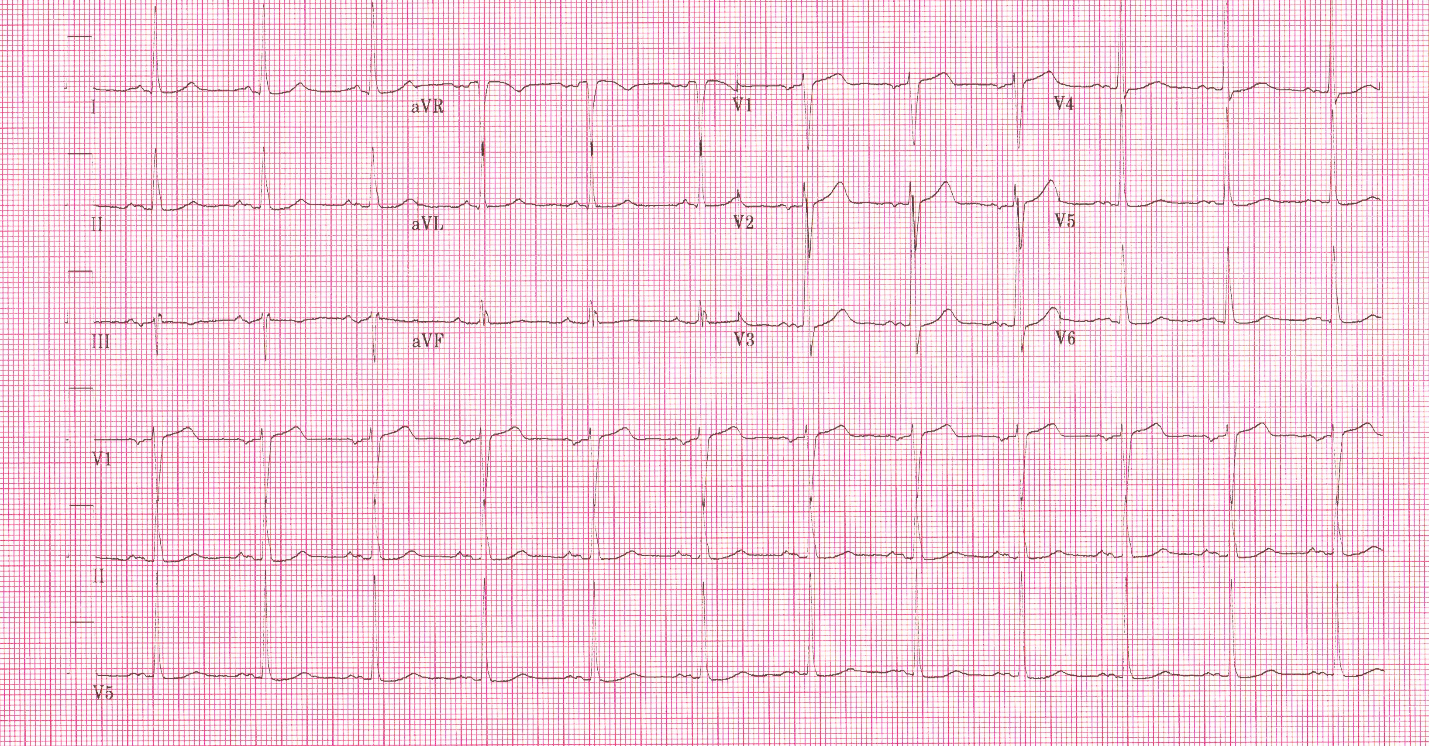
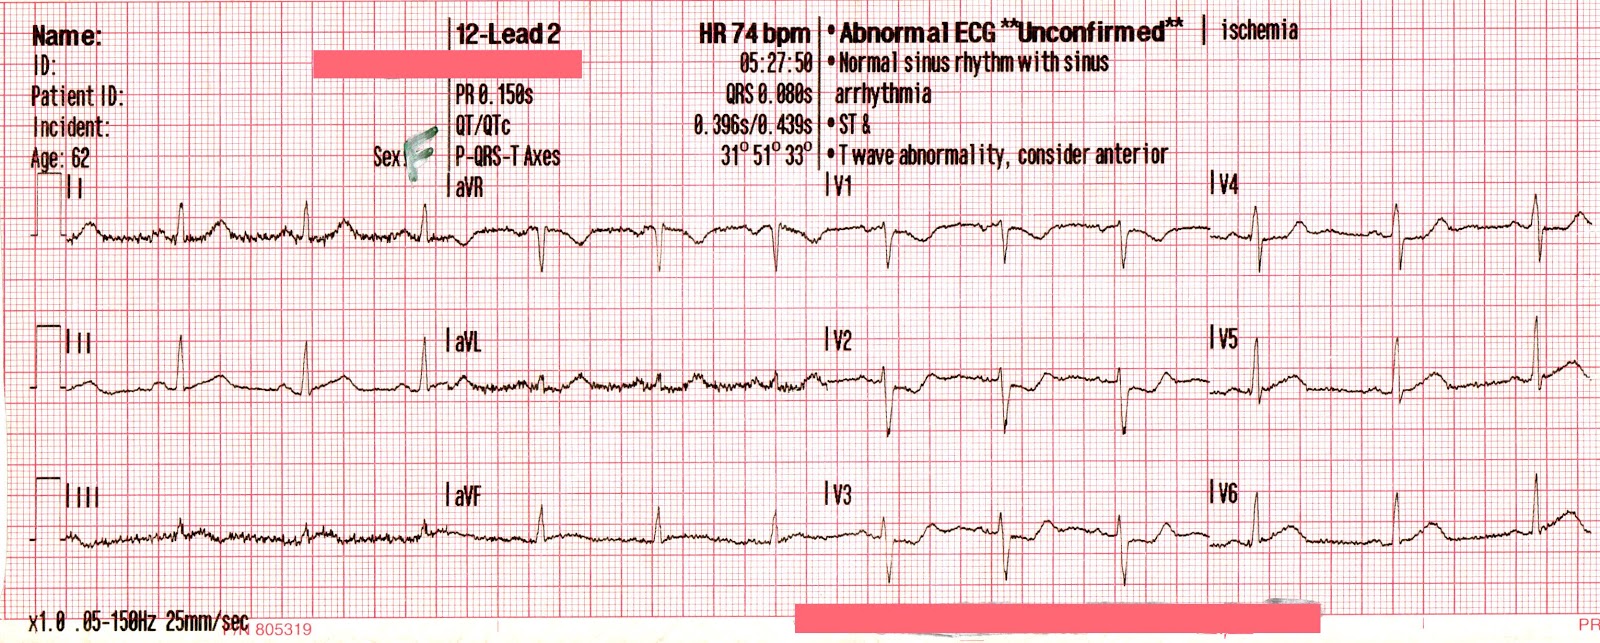
In contrast, true electrical capture will show wide QRS complexes with tall, broad T-waves.
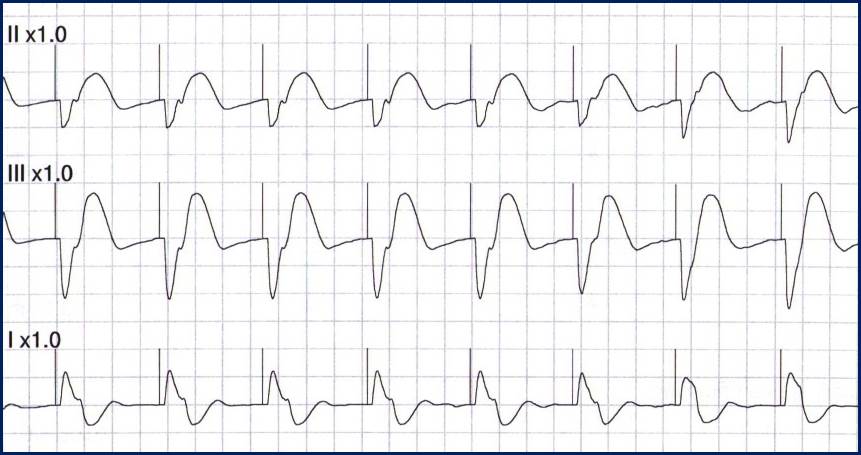
Transcutaneous pacing (TCP) with true electrical capture as evidenced by tall, broad T-waves. Capture was achieved at 110 mA (ems12lead.com).
Tips for success
- Perform, but do not rely on a pulse check!
- Use an instrument (SpO2, Doppler, capnography, or echo) to help confirm mechanical capture whenever possible
- Do not be fooled by skeletal muscle contraction!
- Know that the patient may become more alert whether capture is achieved or not
- The most common reasons for “failure to capture” are insufficient milliamperes and poor pad placement!
More examples of transcutaneous pacing (TCP) with capture
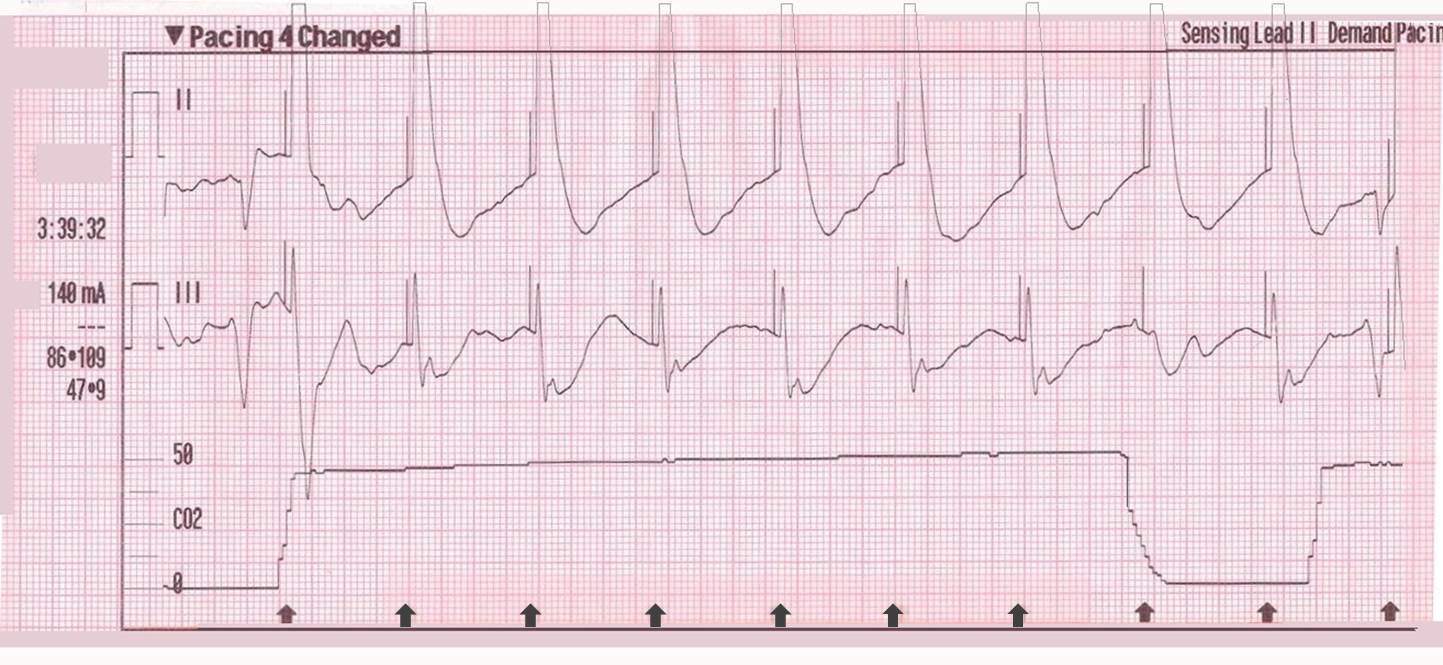
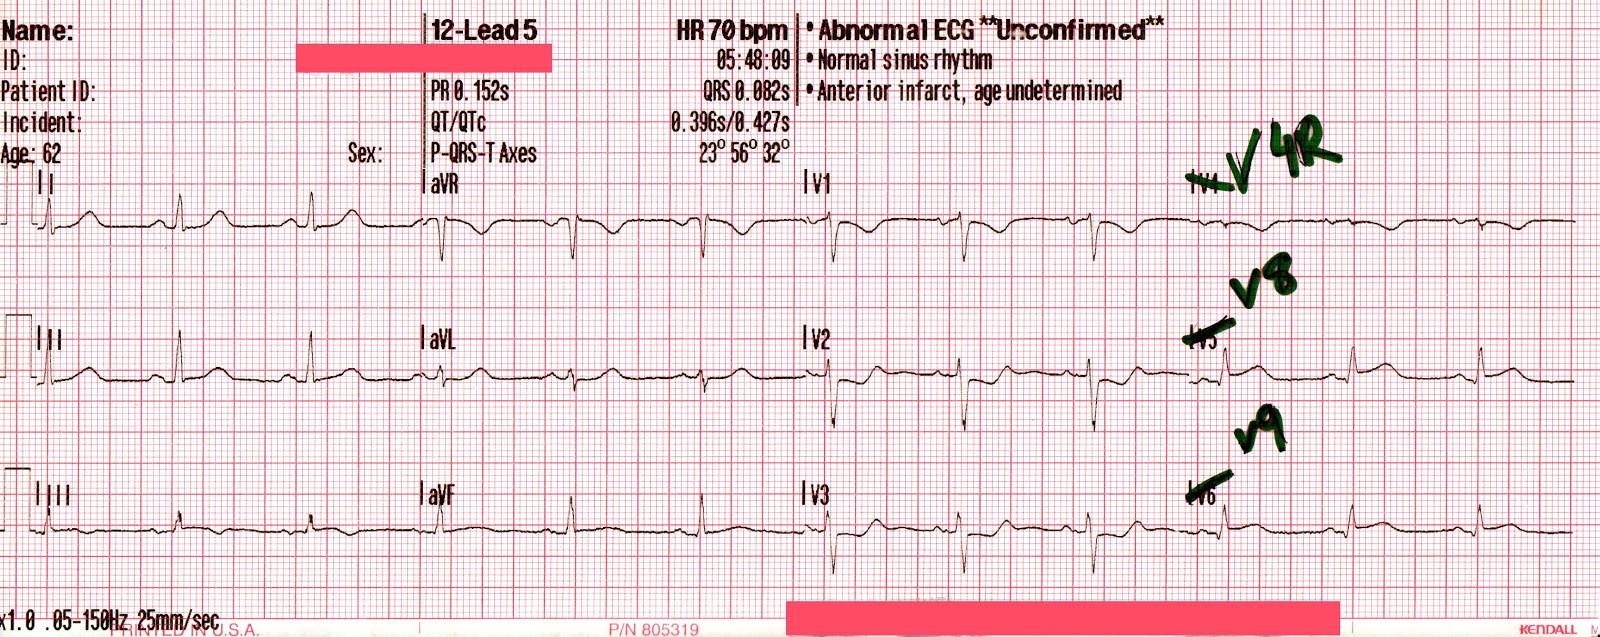
Capture achieved at 140 mA and confirmed with sudden rise in ETCO2 (ems12lead.com).
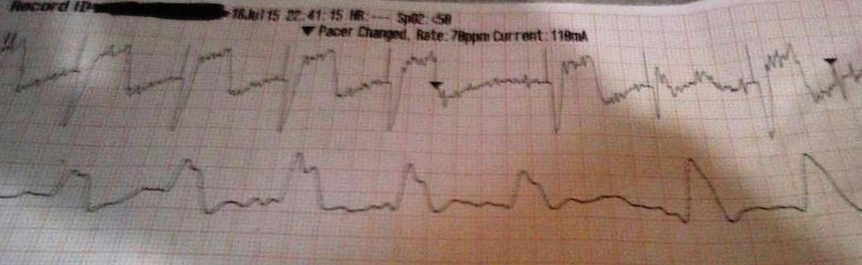
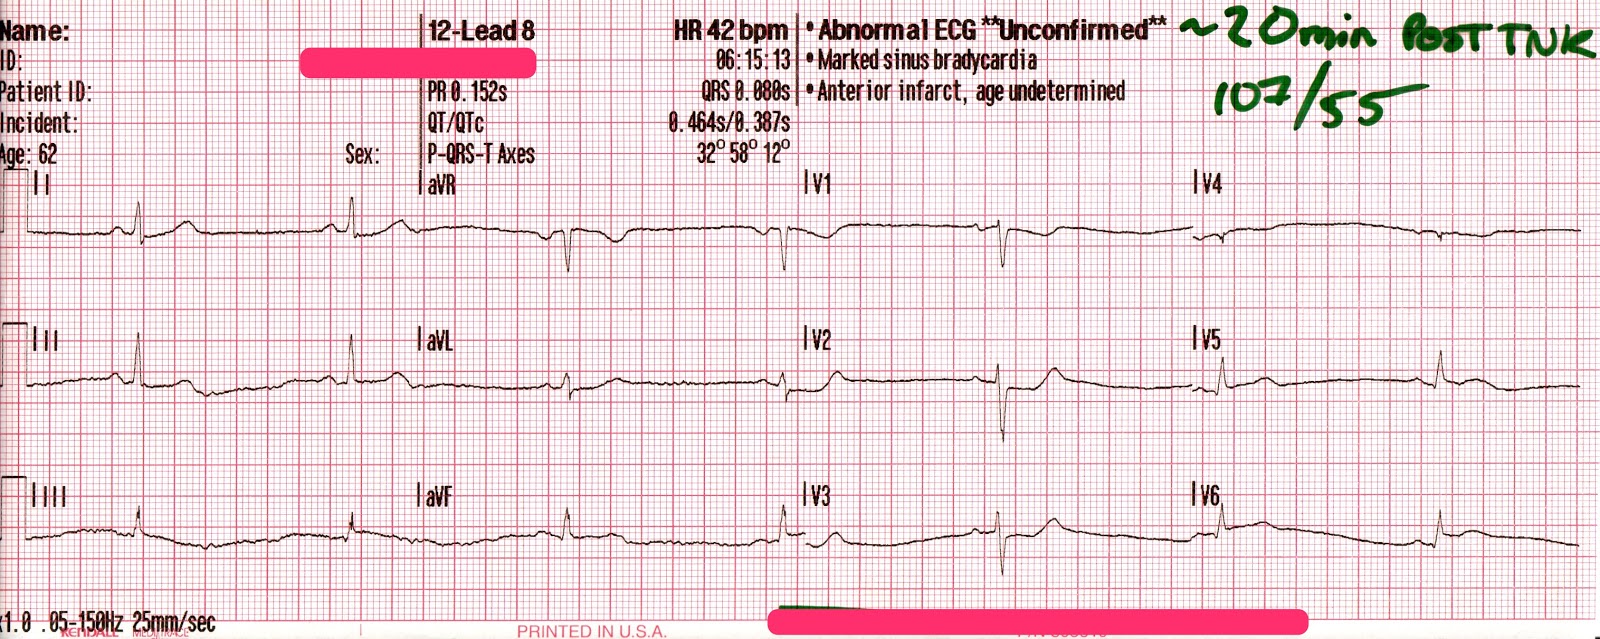
Capture achieved at 110 mA confirmed with SpO2 plethysmograph
Reference
- Ettin DCook T. Using ultrasound to determine external pacer capture. The Journal of Emergency Medicine. 1999;17(6):1007-1009.
Further reading
Pacing Artifact May Masquerade As Capture
This case was submitted by Roger Hancock with edits by Tom Bouthillet. Some details have been changed to protect patient confidentiality.